

The United States Wind Turbine Database (USWTDB) provides onshore & offshore wind turbine locations in the United States, corresponding facility information, and turbine technical specifications. The USWTDB Viewer, a product from the U.S. Geological Survey, lets users visualize, inspect, interact, and download the USWTDB through a simple web application. In this detailed guide, we will take a tour of the various components of the Viewer and show you what each can do. Be sure to check out our quick start video to see the Viewer in action. The video shows examples of the items described in the guide below. Have a question? Contact us.
Most web mapping interfaces have a variety of ways to zoom/pan around the map. In the USWTDB Viewer, panning is enabled by default. Simply click anywhere on the map, hold down the left mouse button, and drag the mouse. For touch-enabled devices, simply swipe the map interface. For zooming into an area, we offer the  magnifier tool, but you may find it more convenient to:
To zoom out a single zoom level, click on the  icon or via a spread gesture on touch-enabled devices. To return the initial map view of the conterminous United States, click the
  icon.
icon.
If you have been navigating around the map, two related tools let you toggle between current and previous views. Clicking ![]() will return you to the map view just prior to your current view. If you've used
will return you to the map view just prior to your current view. If you've used ![]() to “step back”, then
to “step back”, then ![]() will let you “step forward.”
will let you “step forward.”
You can adjust your pitch and bearing, to get an oblique view of the data in the map interface. Simply hold the CTRL key and left mouse button while you drag the mouse. To reset your map view to the default pitch and bearing values, click the  icon.
icon.
To find turbines around a location – such as your house, a town, or a larger area – use the location search bar. Enter specific information, such as your full street address (e.g., 12201 Sunrise Valley Drive, Reston, VA 20192) or a latitude/longitude coordinate pair, or more general information (e.g., zip code, town name, or county name). Note that, when using a latitude/longitude pair, longitude is preceded by a minus sign if it is west of the prime meridian (locations in the United States, for example). The location tool accepts latitude/longitude pairs in decimal degrees, separated by a comma (e.g., 38.5, -98.30).
If you provide a unique and specific location, like an address or a zip code, the Viewer will zoom to the location and generate a list of projects that intersect the map view. If you enter more general information (e.g., Boston), a dropdown list will appear (e.g., Boston, Massachusetts; Boston Harbor Islands; Boston National Historical Park) –select one, and you will be zoomed to that feature.
When you hover over or click on any turbines in the interface, a pop-up populated with turbine specific attributes appears. Turbine attribute data were gathered from the Federal Aviation Administration's Digital Obstacle File (DOF) and Obstruction Evaluation Airport Airspace Analysis (OE-AAA), the American Clean Power Association (ACP), Lawrence Berkeley National Laboratory (LBNL), the U.S. Geological Survey (USGS), and online sources.
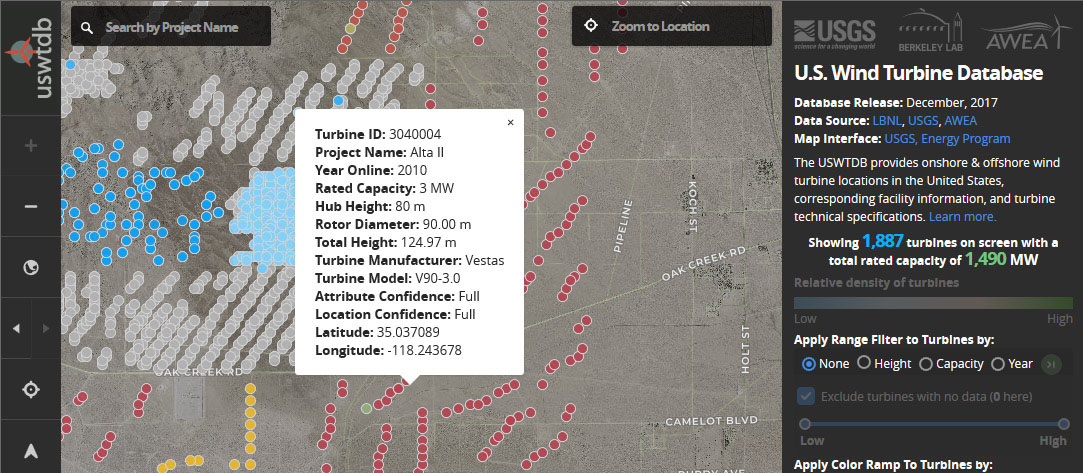
Turbine ID – A unique stable integer used for turbine identification purposes.
Project Name – Name of the wind power project a turbine is part of. Project names are typically provided to ACP by the project developer. We identified some names via other web resources. Projects without specific known names were assigned a name based on the county they occupy.
Project State – State where turbine is located.
Year Online – The year that the wind power project became operational and began providing power. In some cases, the year is estimated based on the year the turbine was constructed.
Rated Capacity – Manufacturer's stated output power for this turbine at rated wind speed, in megawatts.
Hub Height – Height at which the nacelle and hub are mounted, in meters.
Rotor Diameter – Diameter of the sweep of the turbine's blades, in meters.
Total Height – Height of the turbine from ground to the tip of a vertically extended blade, in meters. Computed as the hub height plus half of the rotor diameter when those data are available.
Turbine Manufacturer – Name of the original equipment manufacturer of the turbine.
Turbine Model – Manufacturer's model name of the turbine.
Specific Power – The ratio of a turbines rated capacity (watts) to it's rotor swept area(m2). Typically, a decline in specific power should lead to an increase in turbine capacity factor.
Attribute Confidence – Level of confidence in the turbine's attribute values. "Low" – no confidence: no information available currently. "Medium" – partial confidence: incomplete information, discrepancies across data sources, or other issues found. "High" – full confidence: consistent information across multiple data sources.
Location Confidence – Level of confidence in the turbine's location. "Low" – no confidence: nothing on image, image has clouds, turbine was never built or was previously removed, or newer imagery is needed. "Medium" – partial confidence: image shows developed pad with base and/or turbine parts on ground. "High" – full confidence: consistent information across multiple data sources.
Latitude – Current latitude of the turbine point, in decimal degrees (NAD 83).
Longitude – Current longitude of the turbine point, in decimal degrees (NAD 83).
When you interact with the Viewer, a wind project table becomes populated along the right side of the interface. By default, the table lists all wind projects that appear within the current view and includes information like project name, project year online, and the number of turbines in the project. To highlight a particular project in the map interface, simply mouseover that project's table record. Clicking the record zooms the map view to the selected project. Above the project table, you can see the number of projects currently in the map view based on the filter(s) being applied (capacity range, date range, project name keyword, etc.).
You can sort the project table by project name, year online, project turbine count, or average project capacity by clicking any of the sort buttons above the project table. Note that the sort method you choose persists as you populate additional project tables. This is especially useful if, for example, you always want the most recent projects in the database to take priority in your project table updates.
The basic metadata information for particular projects can be viewed in the projects table. The information in each project record includes:
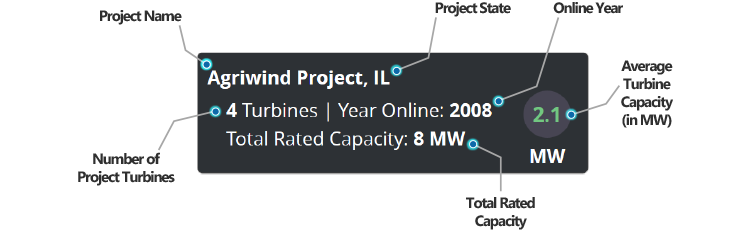
Project Name – Name of the wind power project that the turbine is part of. If the project does not have a specific known name, a name is assigned based on the county in which the turbines are located.
Project State – State in which the turbine is located. NA is used for offshore turbines where a State designation is not applicable.
Number of Project Turbines – In the USWTDB Viewer, this number is computed from the actual number of project turbines in the database. Projects are defined as unique name, year, and state that are mapped in the USWTDB. Note these are not ground verified. In the USWTDB tabular data source, this is the number of project turbines as reported by primary data sources (i.e. project manager, manufacturer, etc.). This may differ from the number of turbines visible in the USWTDB Viewer.
Online Year – Year (or years) the wind power project became operational and began providing power. A list of years indicates that areas of the project were completed at different times. Hover over any year in the list to see turbines relevant to any given year. In some cases, the year is estimated based on the year the turbine was constructed.
Total Rated Capacity – In the USWTDB Viewer, this number is computed by summing the rated capacity of the actual number of project turbines in the database. Projects are defined as unique name, year, and state that are mapped in the USWTDB. Note these are not ground verified. In the USWTDB tabular data source, this is the cumulative nameplate capacity of all turbines in the wind power project, in megawatts, as reported in primary data sources (i.e. project manager, manufacturer, etc.). This may differ from the total rated capacity of turbines visible in the USWTDB Viewer.
Average Turbine Capacity – Estimated average capacity of an individual turbine in the selected wind power project, in megawatts. Computed as Total Rated Capacity divided by the Number of Project Turbines.
Image Source Date – Acquisition date of the aerial image used to confirm the facility location, usually as provided by the image vendor.
Users who are familiar with wind turbine project names can locate them sing the project keyword search bar in the upper-left corner of the interface. As you type, project search returns matching your inquiry become auto-populated in a dropdown list below the input field. Simply click the name of the project in the dropdown list to be zoomed automatically to the project site.
By default, the first five project keyword matches are returned in the dropdown list. Adding additional characters will refine the search for projects with similar names.
Filtering turbine data in the USWTDB Viewer is dynamic and interactive. When you use the range filter (activated when you choose a turbine property to filter), the Viewer recalculates turbine counts, total rated capacity, number of projects, and then applies automatic updates to the map interface.
Turbine data can be filtered by total height, rated capacity, or year online. In the example above, a range filter is applied to turbine capacity and then total height near Sweetwater, TX. The selected active range in the range filter restricts turbines to those with capacities and total heights between the two handles of the range filter.
By default, attributes with no-data values for the selected turbine filter property are excluded from the map when applying a range filter. To show all turbines, simply choose the "None" filter.
The USWTDB Viewer supports data-driven color styling based on various turbine properties including total height, capacity, and online year. Color ramp styling applied to turbine features gives the user a snapshot of turbine property values without having to query each turbine directly.
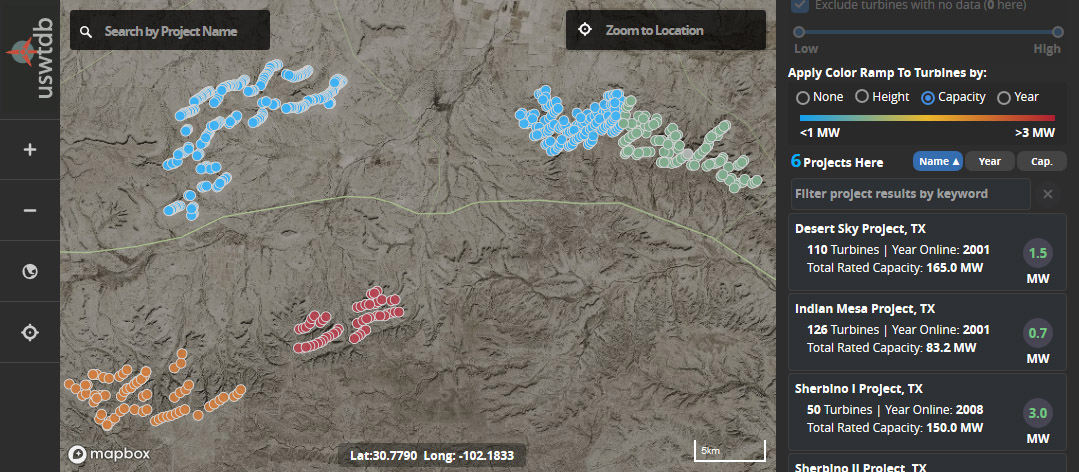
In the example above, a color ramp based on capacity is shown for turbine features near Sweetwater, TX. Comparing the color ramp legend on the right of the interface to the features in the map view, users can quickly determine that the southern turbines in this area have higher rated capacities.
The USWTDB Viewer allows you to toggle from a records table view to an interactive chart view by clicking the  icon. In the interactive chart view, charts showing the distribution of turbine capacities, turbine specific power over time, and cumulative annual turbine capacity will be populated for turbines currently visible in the map window. Simply pan or zoom to your area of interest and charts will dynamically update to reflect the visible turbines in the map window. Charts are tied to any active filter and will dynamically update when a filter is updated/applied.
If you mouseover/click/tap any component of a chart, the relevant turbines will be highlighted in the map window. In the example above, we toggle from table view to interactive chart mode and mouseover the various chart areas that represent site type from the "Distribution of Turbine Capacities" and "Average Annual Specific Power" charts. Notice that when any section of a chart is active, the relevant turbine sites are highlighted in the interface. Not that updating the range filter will dynamically update the chart data to reflect the filtered data on screen.
To visualize the progression of turbine installation over time in a particular area, start by clicking the “Year” button at the right side of the interface. A playback icon  next to the “Year” button will become active. Set the years you would like to visualize through time by clicking and dragging the end points of the range filter, or leave the minimum and maximum years in their default positions. Zoom to your area of interest and click the playback icon to start the time animation.
The example above shows the progression of turbine development in the Los Angeles area from 1980 to present.
The USWTDB Viewer allows you to see the turbines near your current location by clicking on the  icon. If you have geolocation services enabled on your device/browser, you will be zoomed to your current position. Note that the accuracy of the geolocation tool depends on a variety of factors including user hardware (GPS enabled) and network connection. Location accuracy is depicted in the circle around the estimated location. A large radius usually indicates that Viewer is geolocating based on the device's IP address.
If you pan or zoom to another area, you can re-center your location by clicking the icon again. When your location is no longer centered, the geolocation icon is highlighted yellow. To turn off geolocation simply click the geolocation icon while your location is centered.
To download the source data, click the  to go to the USWTDB Data & Web Services page, where you can download data in a variety of formats based on your specific needs. The file formats and associated metadata files include:
CSV – The CSV (comma-separated values) format is common non-proprietary format for storing tabular data stored in plain text. The use of the comma as a field separator is the source of the name for this file format. CSV files aren't necessarily usable in a geographic information system (GIS) unless they contain geographic information (like latitude and longitude values).
Shapefile – The shapefile format is a popular geospatial vector data format compatible with a variety of GIS software. A shapefile stores non-topological geometry and attribute information for the spatial features in a data set. The geometry for a feature is stored as a shape comprising a set of vector coordinates. It is a (mostly) open specification for data interoperability among GIS software products.
GeoJSON – GeoJSON is an open standard format designed for representing simple geographical features, along with their non-spatial attributes. It is based on JSON (JavaScript Object Notation) and plays an important role in many spatial databases, web APIs, and open data platforms.
Help us improve the USWTDB by telling us how we can better deliver our products or by reporting any problems you have experienced with the site. Have you found any broken links or out-of-date information? Encountered an issue with data downloaded from the site? We want to hear about it, and we read all feedback carefully. The best way to send comments is by emailing us directly. You can send us questions, comments, and suggestions anonymously or with your contact information if you would like a direct response. Please read the U.S. Geological Survey's Privacy Policy before submitting.
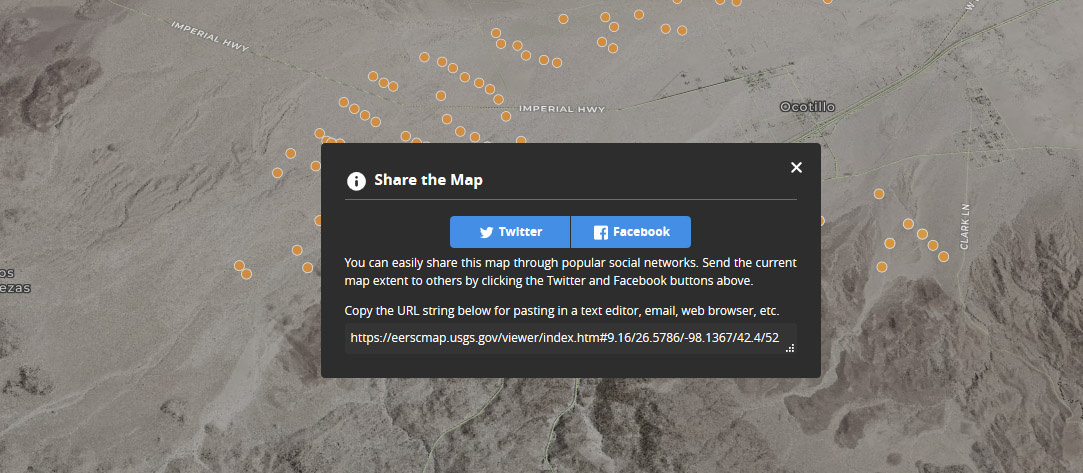
Click on the  icon to open the sharing window. The sharing window lets you send your current Viewer window to popular social networking sites like Twitter and Facebook. You can also copy the URL string for pasting in a text editor, or for sharing via email or web browser.
Everything you need to know so you can use the USWTDB like a pro. Browse through these FAQs and find answers to common USWTDB related questions. Got your own question? The best way to send questions is by emailing us directly.
Q: How many turbines are contained in the USWTDB?
As of February, 2025, the USWTDB contains more than 75,633 turbines constructed since the 1980s in approximately 1,700 wind power projects spanning 43 states plus Puerto Rico and Guam.
Q: How often is the USWTDB updated?
A: The USWTDB is updated quarterly and contains turbines that were installed as recently as 3 months preceding the update.
Q: How do I cite the USWTDB if I want to use the data?
A: The full citation for use in academic papers and otherwise where applicable is as follows:
Hoen, B.D., Diffendorfer, J.E., Rand, J.T., Kramer, L.A., Garrity, C.P., and Hunt, H.E., 2018, United States Wind Turbine Database V8.0 (February 25, 2025): U.S. Geological Survey, American Clean Power Association, and Lawrence Berkeley National Laboratory data release, https://doi.org/10.5066/F7TX3DN0.
Q: How are turbine locations data collected?
The project compiles wind turbine information from the Federal Aviation Administration (FAA), Lawrence Berkeley National Laboratory (LBNL), the American Clean Power Association (ACP), and United States Geological Survey (USGS), as well as online sources. Verification of the turbine position is done by visual interpretation using high-resolution aerial imagery. A detailed description of the data collection and verification process can be found in this webinar.
Q: How are turbine characteristics data collected?
Turbine characteristics data are compiled from ACP's wind turbine and project datasets, LBNL's Land-based Wind Market Report dataset, the legacy (2014) USGS wind turbine dataset, and various online sources. User feedback is also incorporated once verified with other sources. A detailed description of the data collection and verification process can be found in this webinar.
Q: Why isn't the turbine in my backyard shown in the database?
The USWTDB is designed to be a comprehensive source of information for utility-scale wind turbines in the US; residential-scale turbines are excluded. We have removed turbines known to be residential scale and have excluded turbines that are both less than 65 kW in rated capacity and less than 30 meters in total height. Unlike with utility-scale wind, we are not aware of a comprehensive publicly-available data source of residential-scale turbines.
Q: Is there an international database available?
No. To our knowledge, the USWTDB is unique. Other datasets might be available from other countries on an ad hoc basis, but we are not aware of any central repository of those data. For general information and statistics on international wind projects, see thewindpower.net.
Q: How much wind energy does it take to power an average home?
According to the US Energy Information Administration, the average US home uses 867 kilowatt-hours (kWh) per month. The mean turbine capacity in the USWTDB is about 2.05 megawatts (MW). At a 33% capacity factor, that average turbine would generate about 494,000 kWh per month - enough for about 570 average US homes. To put it another way, that average wind turbine generates enough energy in 77 minutes to power an average US home for one month.
Q: Why aren't there more offshore turbines in the database?
The USWTDB includes all utility-scale turbines that have been installed in the US. As of February, 2025 only two offshore farms have been constructed in the US - the Block Island Wind Farm off Rhode Island and the Coastal Virginia Offshore Wind Pilot. However, according to the Department of Energy, several other offshore projects are under construction or in advanced stages of development. When those projects are completed, the turbines will appear in the USWTDB.
Q: Where can I find turbines that are permitted but not built?
The Federal Aviation Administration (FAA) maintains a database of proposed turbines that they are evaluating as potential obstructions to airspace. However, an FAA determination of “non-hazard” is just one step of many in the permitting process, and many turbines evaluated by the FAA are never built.
Q: How many turbines are installed in the U.S. each year?
The number of turbines installed in the U.S. each year varies based on several factors, but an average of 4,000 turbines have been built each year over the past decade.
Q: Where can I find out more about wildlife effects of turbines?
We recommend these resources from the USGS and the American Wind Wildlife Institute.
Q: Are turbines mostly made in the United States?
According to the latest Land-Based Wind Market Report many turbine components are domestically sourced and manufactured. For wind projects installed in 2022, over 85% of nacelle assembly and 70%-85% of tower manufacturing occurred in the United States. For blades, domestic content was just 5-25% in 2022, having plummeted in recent years. How these trends change after passage of the Inflation Reduction Act remains to be seen, though supply-chain announcements in recent months suggest a resurgence in domestic manufacturing.
Q: What materials are turbines made of?
According to a report from the National Renewable Energy Laboratory, wind turbines are predominantly made of steel (71-79% of total turbine mass), fiberglass, resin, or plastic (11-16%), iron or cast iron (5-17%), copper (1%), and aluminum (0-2%).
Q: Why is it important to know the locations of wind turbines?
Knowing the location of individual turbines and their technical specifications creates new opportunities for research and improved siting and is important information for land and resource management. In addition, large turbines can affect weather and air traffic radar. Knowing the location and height of turbines creates a better understanding of radar-wind issues and increases the effectiveness of planning both new radar and new wind locations.
The legacy version of the USGS wind project database was updated through 2014 and is incorporated into the USWTDB.
ACP releases quarterly reports tracking utility-scale U.S. wind turbine installations.
The U.S. Department of Energy publishes several annual Wind Market Reports. These include reports on U.S. utility-scale wind projects—analyzing technology, cost, price, and performance trends along with broader industry developments and policy and market drivers—as well as reports on the offshore wind and distributed wind markets.
Diffendorfer, J.E., Kramer, L.A., Ancona, Z.H., and Garrity, C.P., 2015, Onshore industrial wind turbine locations for the United States up to March 2014, Scientific Data 2: 150060, http://dx.doi.org/10.1038/sdata.2015.60.
Diffendorfer, J.E., Compton, R.W., Kramer, L.A., Ancona, Z.H., and Norton, Donna, 2015, Onshore industrial wind turbine locations for the United States to March 2014: U.S. Geological Survey data release, https://doi.org/10.5066/F7251G8Q.
Diffendorfer, J.E., Compton, Roger, Kramer, L.A., Ancona, Zach, and Norton, Donna, 2014, Onshore industrial wind turbine locations for the United States through July 2013: U.S. Geological Survey data release, https://doi.org/10.5066/F7X06561.
Federal Aviation Administration, Digital Obstacles File, in Terrain and Obstacles Data (TOD) Team—Digital Obstacles File (DOF): Federal Aviation Administration, https://www.faa.gov/air_traffic/flight_info/aeronav/digital_products/dof/.
Federal Aviation Administration, Obstruction Evaluation Case Information, Obstruction Evaluation/Airport Airspace Analysis (OE/AAA) team, https://oeaaa.faa.gov/oeaaa/external/public/publicAction.jsp?action=showCaseDownloadForm.
Rand, J.T., Kramer, L.A., Garrity, C.P. et al. A continuously updated, geospatially rectified database of utility-scale wind turbines in the United States. Sci Data 7, 15 (2020). https://doi.org/10.1038/s41597-020-0353-6.
U.S. Energy Information Administration, Form EIA-860 detailed data, in Electricity: U.S. Energy Information Administration, http://www.eia.gov/electricity/data/eia860/.
Mid-Atlantic Ocean Data Portal, Renewable Energy Data Catalog: Renewable Energy https://portal.midatlanticocean.org/data-catalog/energy/.