
The United States Large-Scale Solar Photovoltaic Database (USPVDB) provides the locations and array boundaries of U.S. front-of-the-meter, photovoltaic (PV) facilities with capacity of 1 megawatt or more. The USPVDB Viewer, a product from the U.S. Geological Survey, lets users visualize, inspect, interact, and download the USPVDB through a simple web application. In this detailed guide, we will take a tour of the various components of the Viewer and show you what each can do. Have a question? Contact us @ [email protected]; [email protected].
Most web mapping interfaces have a variety of ways to zoom/pan around the map. In the USPVDB Viewer, panning is enabled by default. Simply click anywhere on the map, hold down the left mouse button, and drag the mouse. For touch-enabled devices, simply swipe the map interface. For zooming into an area, we offer the  magnifier tool, but you may find it more convenient to:
To zoom out a single zoom level, click on the  icon or via a spread gesture on touch-enabled devices. To return the initial map view of the conterminous United States, click the
  icon.
icon.
Two related tools let you toggle between current and previous views, and may be useful if you have been navigating around the map. Clicking ![]() will return you to the map view just prior to your current view. If you've used
will return you to the map view just prior to your current view. If you've used ![]() to “step back”, then
to “step back”, then ![]() will let you “step forward.”
will let you “step forward.”

You can adjust your pitch and bearing, to get an oblique view of the data in the map interface. Simply hold the CTRL key and left mouse button while you drag the mouse. To reset your map view to the default pitch and bearing values, click the  icon.
icon.
To find solar projects around a location, such as your house, a town, or a larger area, use the location search bar. Enter specific information, such as your full street address (e.g., 12201 Sunrise Valley Drive, Reston, VA 20192) or a latitude/longitude coordinate pair, or more general information (e.g., zip code, town name, or county name). Note that, when using a latitude/longitude pair, longitude is preceded by a minus sign if it is west of the prime meridian (locations in the United States, for example). The location tool accepts latitude/longitude pairs in decimal degrees, separated by a comma (e.g., 38.5, -98.30).
If you provide a unique and specific location, like an address or a zip code, the Viewer will zoom to the location and generate a list of solar projects that intersect the map view. If you enter more general information (e.g., Boston), a dropdown list will appear (e.g., Boston, Massachusetts; Boston Harbor Islands; Boston National Historical Park)–select one, and you will be zoomed to that feature.
When you hover over or click on any solar project in the interface, a pop-up populated with project specific attributes appears. Project attribute data were created by combining publicly available data from the U.S. Energy Information Administration (EIA) with several additional sources.
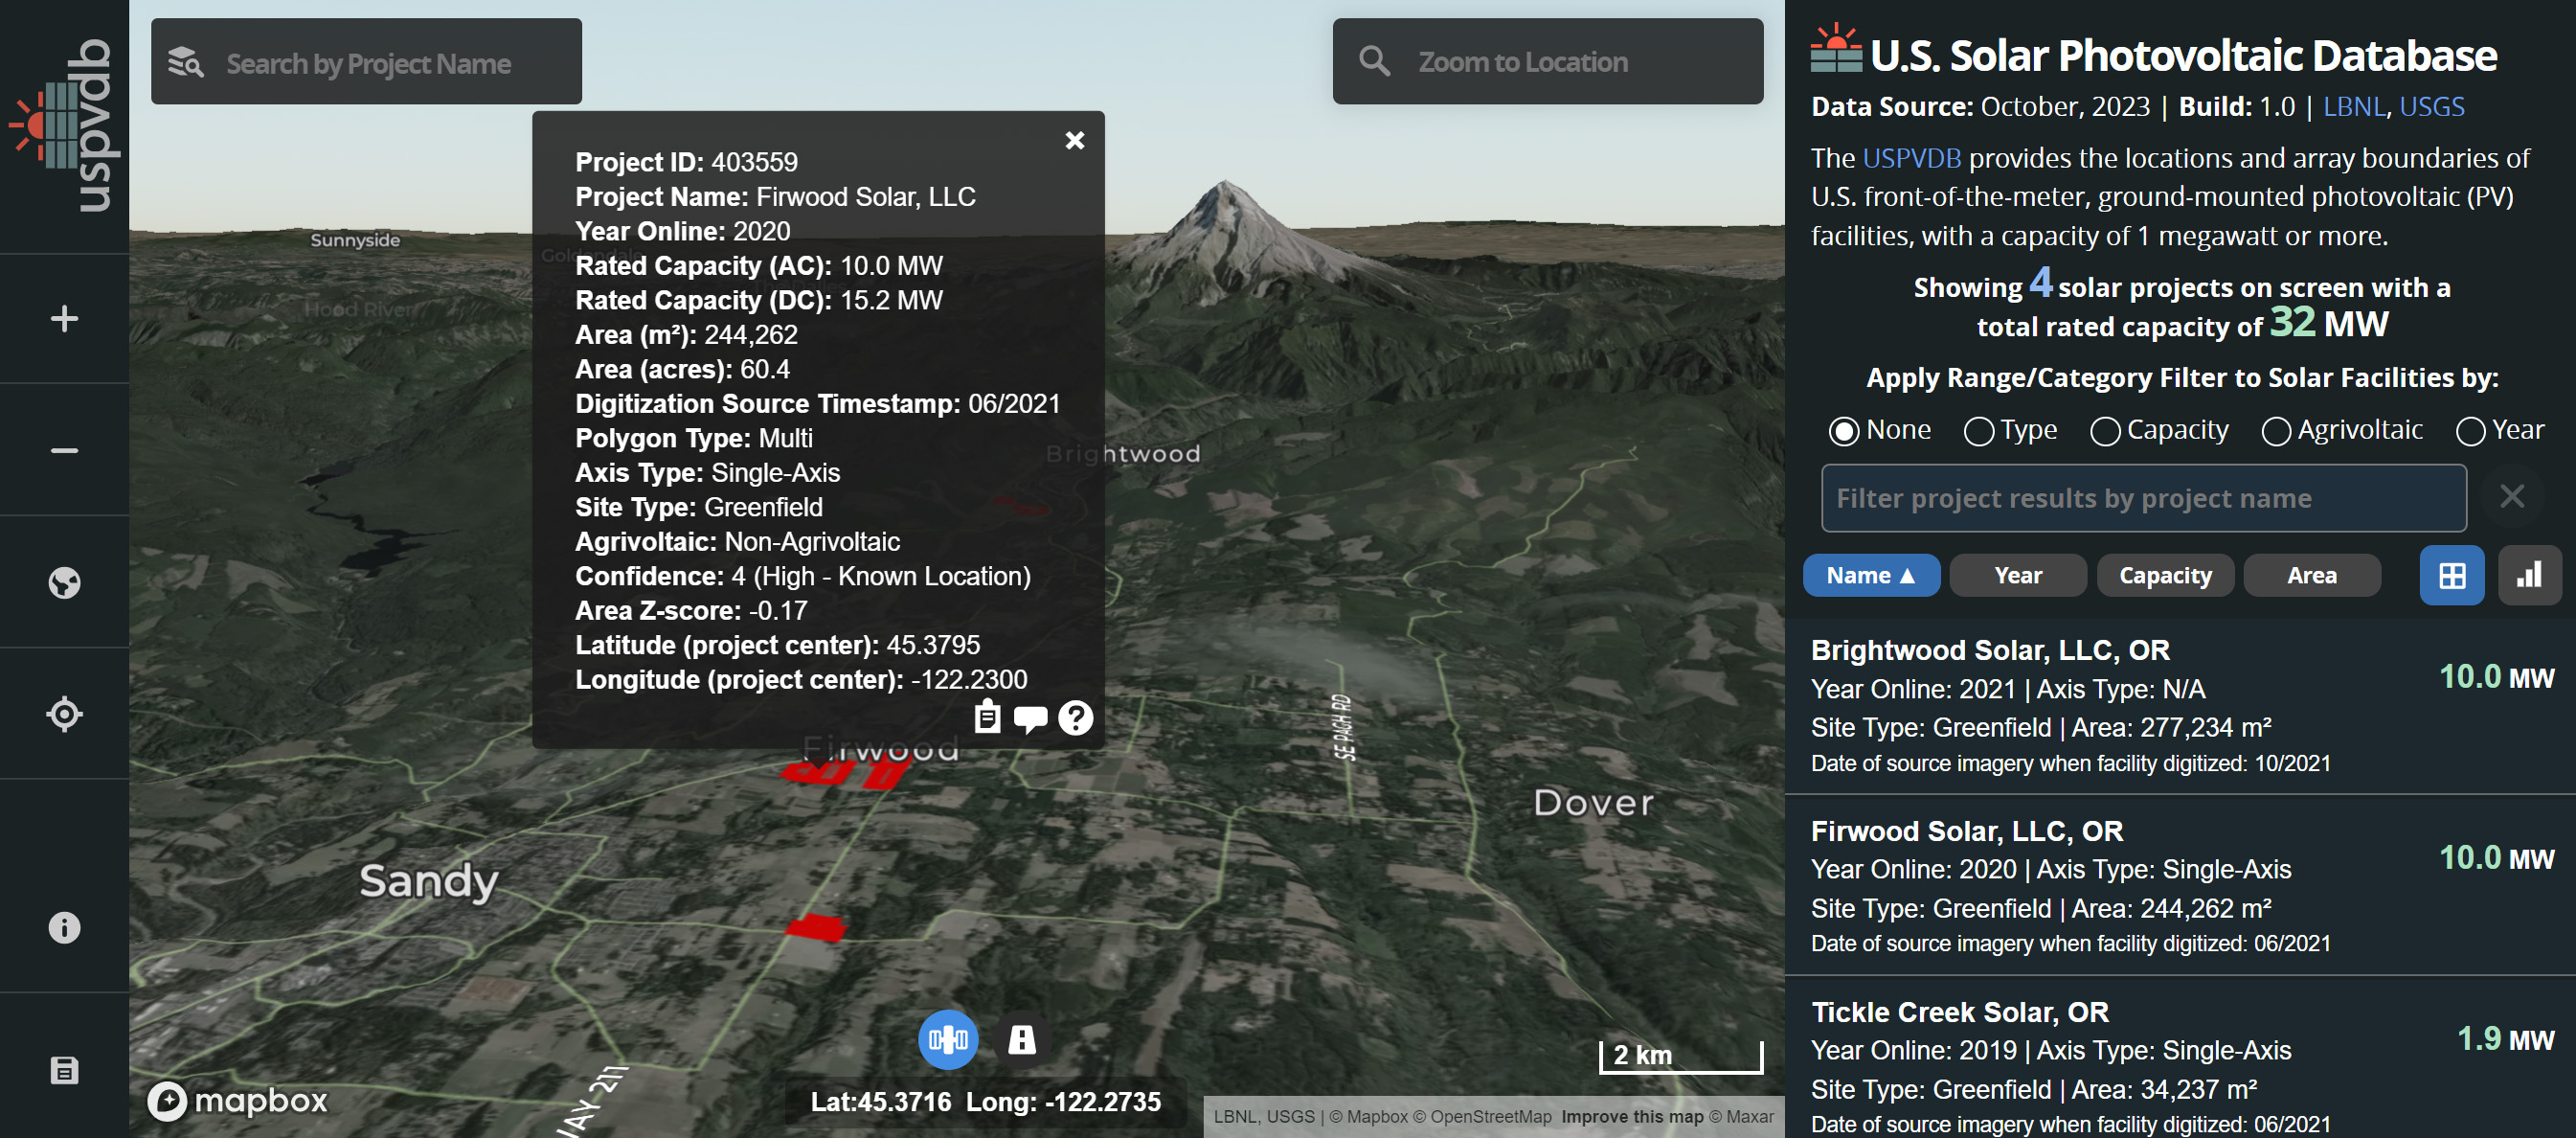
Project ID – A unique stable integer used for solar project identification purposes. Derived from EIA Form 860.
Project Name – Name of the solar project. Project names are typically pulled from EIA Form 860 or by the project developer.
Year Online – The year that the solar project became operational and began providing power.
Rated Capacity (AC) – Solar project AC capacity in megawatts (MW).
Rated Capacity (DC) – Solar project DC capacity in megawatts (MW).
Area (m2) – Area of the solar project array(s) in square meters (m2).
Area (acres) – Area of the solar project array(s) in acres.
Digitization Source Timestamp – Date of the aerial image used to confirm the project location and geometry. This information was derived from aerial image vendor metadata at time of capture.
System Type –Large-scale PV facility system type, or combination of system types. ground—ground mounted system, typically in open land areas. rooftop—systems mounted on building rooftops. canopy—canopy system on elevated structures and over surfaces like parking lots. floating—floating system on a body of water.
Polygon Type – Indicates the project's polygon type. Single – project is represented by a single polygon. Multi – project is represented by multipart polygon composed of at least two polygons, sharing a single record.
Axis Type – Solar project array axis type. Single-axis – Single-axis solar tracker is a unidirectional system that can move only on one axis of movement, which typically allows for it to move East to West. Fixed-tilt – A fixed tilt array is a type of solar panel installation in which the solar panels are mounted at a fixed angle and orientation, typically facing south to maximize sunlight exposure. Dual-axis – Dual-axis solar panels allow multi directional tracking so the solar panels maintain an optimal 90° angle to the sun at all times.
Site Type – General categorization of solar project. Greenfield – greenfield sites occupy land that may have previously been wildland, urbanized, cultivated, or reclaimed. RCRA – Resource Conservation and Recovery Act (RCRA) sites are a specific category of commercial, industrial, and federal facilities that treat, store or dispose of hazardous wastes and that require cleanup under the RCRA Hazardous Waste Corrective Action Program. Superfund – superfund sites are inactive or abandoned contaminated facilities or locations where there is an active release or threatened release into the environment of hazardous substances that have been dumped, discharged, emitted or otherwise improperly managed. These sites may include manufacturing and industrial facilities, processing plants, landfills, and mining sites, among others. AML – sites include abandoned hardrock mines and mineral processing sites listed in the Superfund Enterprise Management System. Landfill – sites that have been designated as landfills in EPA's RE-Powering Matrix. Landfill Named – assigned in cases where EPA did not identify the site as a landfill, but the project name includes the word "landfill." It is possible that these sites have been sufficiently cleaned or were never contaminated to the point of meeting the PCSC designation; thus, they are distinguished from EPA designated landfill sites. PCSC – when no specific designation is provided in EPA's RE-Powering Matrix, "brownfield" sites were assigned to a generalized PCSC project type.
Agrivoltaic – Agrivoltaic facilities make use of the land between panel rows and surrounding arrays for agricultural (i.e., crop production or grazing) and/or ecosystem services (e.g., pollinator habitat). Agrivoltaic projects are categorized into the following designations: crop, crop,es, es, grazing, grazing,es, and non-agrivoltaic.
Confidence – Level of confidence in project location. 1 – Multiphase project or multiple EIA records with identical location. Single polygon used to represent multiple projects indistinguishable from one another; attributes may not reflect full scope of facilities. 2 – Multiple polygons created, but EIA records are unclear; attributes may not reflect full scope of facilities. 3 – Polygon reflects only a part of the project due to poor image quality; area of polygon may not reflect the full size of array(s). 4 – Project polygon created with high confidence.
Area Z-score – The Z-score of (AC power/area). A Z-score measures how far a record is from the mean of all records in the field in units of standard deviations. Records with high or low Z-scores may have an error in either project AC capacity or project area.
Latitude – Latitude of the solar project centroid, in decimal degrees (NAD83).
Longitude – Longitude of the solar project centroid, in decimal degrees (NAD83).
When you zoom in far enough, a solar project records table becomes populated along the right side of the interface. By default, the table lists all solar projects that appear within the current view and includes information like project name, project year online, project area, and other related attribute information of the project. To highlight a particular project in the map interface, simply mouseover that project's table record. Clicking the record zooms the map view to the selected project. Above the project table, you will see the number of projects currently in the map view based on the filter(s) being applied (capacity range, date range, project name keyword, etc.).

You can sort the project table by project name, year online, average project capacity, or project area by clicking any of the sort buttons above the project table. Note that the sort method you choose persists as you populate additional project tables. This is especially useful if, for example, you always want the most recent projects in the database to take priority in your project table updates.
The basic metadata information for particular projects can be viewed in the projects table. The information in each project record includes:
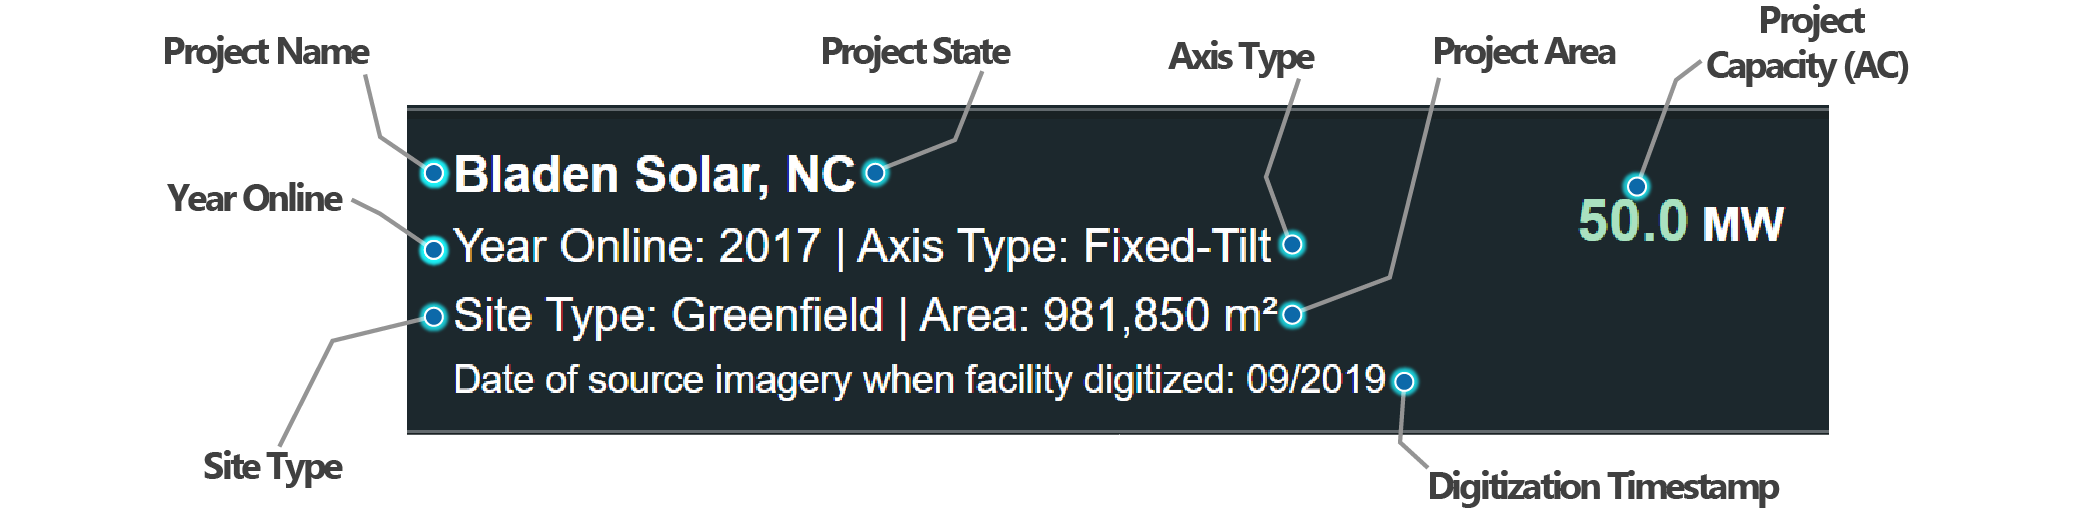
Project Name – Name of the solar project. Project names are typically pulled from EIA Form 860 or by the project developer.
Project State – State in which the solar project is located.
Year Online – The year that the solar project became operational and began providing power.
Axis Type – Solar project array axis type. Single-axis – Single-axis solar tracker is a unidirectional system that can move only on one axis of movement, which typically allows for it to move East to West. Fixed-tilt – A fixed tilt array is a type of solar panel installation in which the solar panels are mounted at a fixed angle and orientation, typically facing south to maximize sunlight exposure. Dual-axis – Dual-axis solar panels allow multi directional tracking so the solar panels maintain an optimal 90° angle to the sun at all times.
Site Type – General categorization of solar project. Greenfield – greenfield sites occupy land that may have previously been wildland, urbanized, cultivated, or reclaimed. RCRA – Resource Conservation and Recovery Act (RCRA) sites are a specific category of commercial, industrial, and federal facilities that treat, store or dispose of hazardous wastes and that require cleanup under the RCRA Hazardous Waste Corrective Action Program. Superfund – superfund sites are inactive or abandoned contaminated facilities or locations where there is an active release or threatened release into the environment of hazardous substances that have been dumped, discharged, emitted or otherwise improperly managed. These sites may include manufacturing and industrial facilities, processing plants, landfills, and mining sites, among others. AML – sites include abandoned hardrock mines and mineral processing sites listed in the Superfund Enterprise Management System. Landfill – sites that have been designated as landfills in EPA's RE-Powering Matrix. Landfill Named – assigned in cases where EPA did not identify the site as a landfill, but the project name includes the word "landfill." It is possible that these sites have been sufficiently cleaned or were never contaminated to the point of meeting the PCSC designation; thus, they are distinguished from EPA designated landfill sites. PCSC – when no specific designation is provided in EPA's RE-Powering Matrix, "brownfield" sites were assigned to a generalized PCSC project type.Area (m2) – Area of the solar project array(s) in square meters (m2).
Rated Capacity (AC) – Solar project AC capacity in megawatts (MW).
Digitization Source Timestamp – Date of the aerial image used to confirm the project location and geometry. This information was derived from aerial image vendor metadata at time of capture.
Advanced users who are familiar with the solar project names can find them via the project keyword search bar in the upper left of the interface. As you type, project search returns matching your inquiry become auto-populated in a dropdown list below the input field. Simply click the name of the project in the dropdown list to be zoomed automatically to the project.
By default, the first five project keyword matches are returned in the dropdown list. Adding additional characters will refine the search for projects with similar names.
Filtering solar project data in the USPVDB viewer is dynamic and interactive. When you filter data with range filter (activated when you choose a solar project property to filter), the viewer recalculates project counts, total rated capacity, and then applies automatic updates to the map interface.
Solar project data can be filtered by project type, rated capacity, agrivoltaic type, or year online. In the example above, a range filter is applied to solar projects based on total rated capacity near Fresno, CA. The selected active range in the range filter restricts projects to those with capacities between 10 MW and 30 MW (49 of 122 projects in this area remain).
Not all filters in the interface are range type filters. Some filters allow you to toggle between specific categories of attribute types. For example, choosing the "Type" radio button (project type) will let you toggle between Non-Greenfield Projects and Greenfield Projects. Choosing the "Agrivoltaic" radio button (agrivoltaic type) will let you toggle between Non-Agrivoltaic Projects and Agrivoltaic Projects.
Solar project data can be also filtered by project name or State abbreviation keyword. Simply start entering a project name in the keyword input field and the projects on screen will be filtered as the keyword is entered. A minimum of two characters of the project name are required for the interface to dynamically start filtering. Any combination of characters (substring) within the project name will return the record in the filtered table. If the user wants to quickly filter by State, simply enter the two character State abbreviation in uppercase (i.e. 'VA'). Note that all other active filters will persist when the keyword filter is applied.
The USPVDB viewer supports data-driven color styling on selected filters based on various solar project properties. Applying color ramps to solar projects gives the user a snapshot of project property values without having to query each project directly.
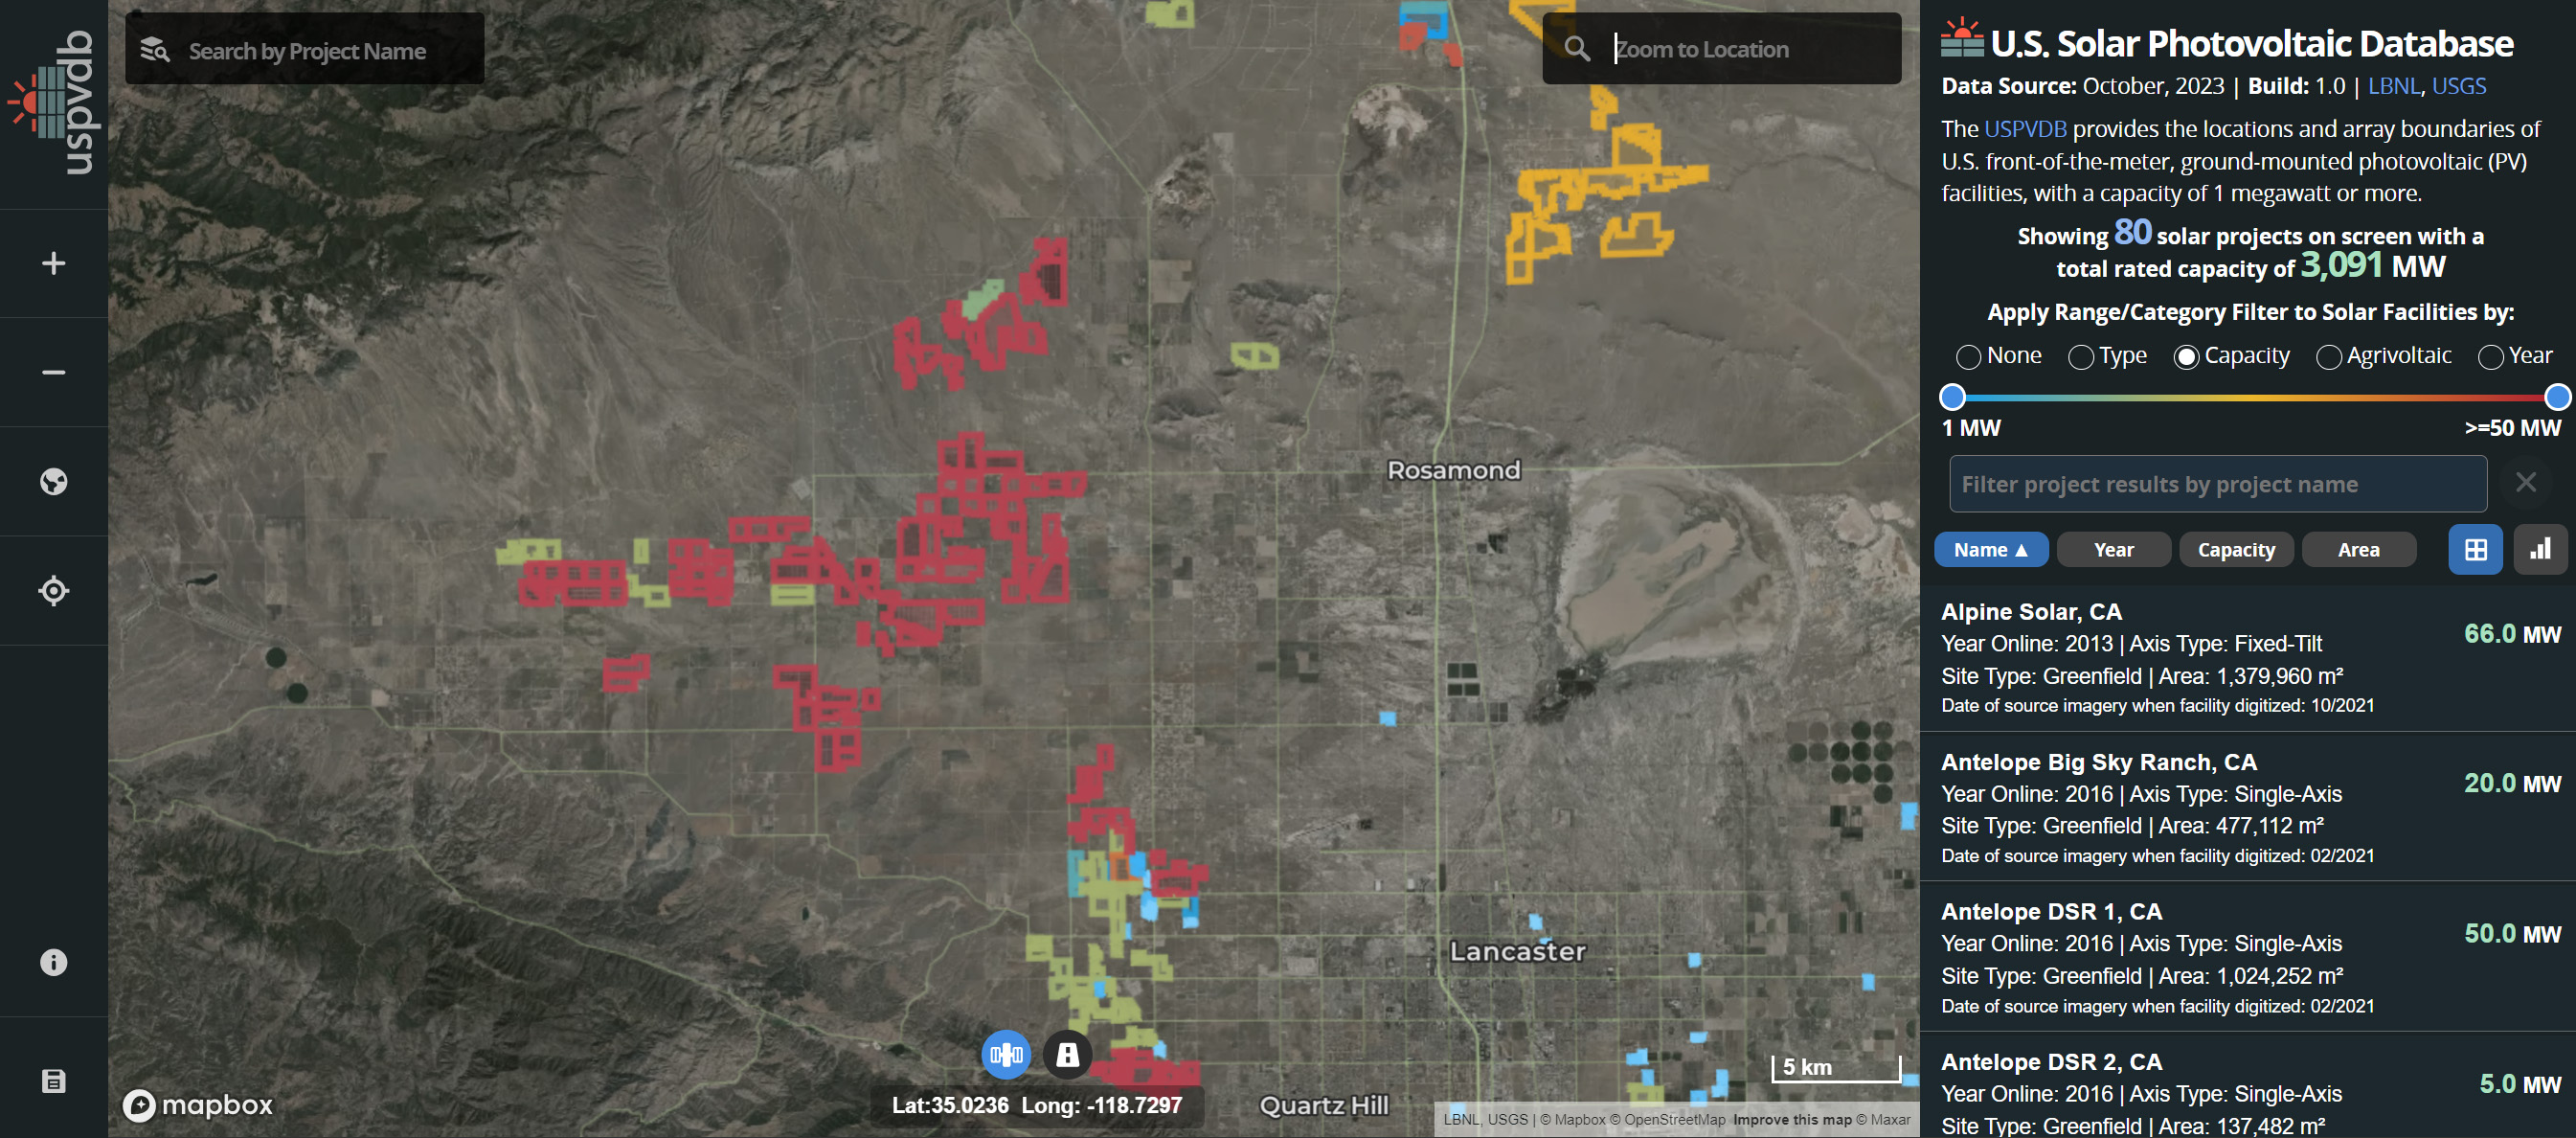
In the example above, a color ramp based on capacity has been applied (by choosing the "Capacity" radio button) to solar projects near Rosamond, CA. Comparing the color ramp legend on the right of the interface to the features in the map view, users can quickly determine that the projects in this area with "hotter" colors, like red and deep oranges, have higher rated capacities.
The USPVDB Viewer allows you to toggle from a records table view to an interactive chart view by clicking the  icon. In the interactive chart view, charts showing the distribution of project capacities, the distribution of site/axis/confidence types, and the cumulative annual capacity will be populated for sites currently visible in the map window. Simply pan or zoom to your area of interest and charts will dynamically update to reflect the visible projects in the map window. Charts are tied to any active filter and will dynamically update when a filter is updated/applied.
If you mouseover/click/tap any component of a chart, the relevant projects will be highlighted in the map window. In the example above, we toggle from table view to interactive chart mode and mouseover the various pie chart areas that represent site type from the "Distribution of Site Types" and "Distribution of Project Capacities" charts. Notice that when any section of a chart is active, the relevant solar projects are highlighted in the interface. Next we apply a range filter for year (2016 to 2019) and examine the "Distribution of Project Capacities" chart. Updating the range filter for year dynamically updates the chart data to reflect the filtered data on screen.
The USPVDB Viewer allows you to see solar projects near your current location by clicking on the  icon. If you have geolocation services enabled on your device/browser, you will be zoomed to your current position. Note that the accuracy of the geolocation tool depends on a variety of factors including user hardware (GPS enabled) and network connection. Location accuracy is depicted in the circle around the estimated location. A large radius usually indicates that Viewer is geolocating based on the device's IP address.
If you pan or zoom to another area, you can re-center your location by clicking the icon again. When your location is no longer centered, the geolocation icon is highlighted yellow. To turn off geolocation simply click the geolocation icon while your location is centered.
To download the source data, click the  to go to the USPVDB Data & Web Services page, where you can download data in a variety of formats based on your specific needs. The file formats and associated metadata files include:
CSV – The CSV (comma-separated values) format is common non-proprietary format for storing tabular data stored in plain text. The use of the comma as a field separator is the source of the name for this file format. CSV files aren't necessarily usable in a geographic information system (GIS) unless they contain geographic information (like latitude and longitude values).
Shapefile – The shapefile format is a popular geospatial vector data format compatible with a variety of GIS software. A shapefile stores non-topological geometry and attribute information for the spatial features in a data set. The geometry for a feature is stored as a shape comprising a set of vector coordinates. It is a (mostly) open specification for data interoperability among GIS software products.
GeoJSON – GeoJSON is an open standard format designed for representing simple geographical features, along with their non-spatial attributes. It is based on JSON (JavaScript Object Notation) and plays an important role in many spatial databases, web APIs, and open data platforms.
Help us improve the USPVDB by telling us how we can better deliver our products or by reporting any problems you have experienced with the site. Have you found any broken links or out-of-date information? Encountered an issue with data downloaded from the site? We want to hear about it, and we read all feedback carefully. The best way to send comments is by emailing us directly. You can send us questions, comments, and suggestions anonymously or with your contact information if you would like a direct response. Please read the U.S. Geological Survey's Privacy Policy before submitting.
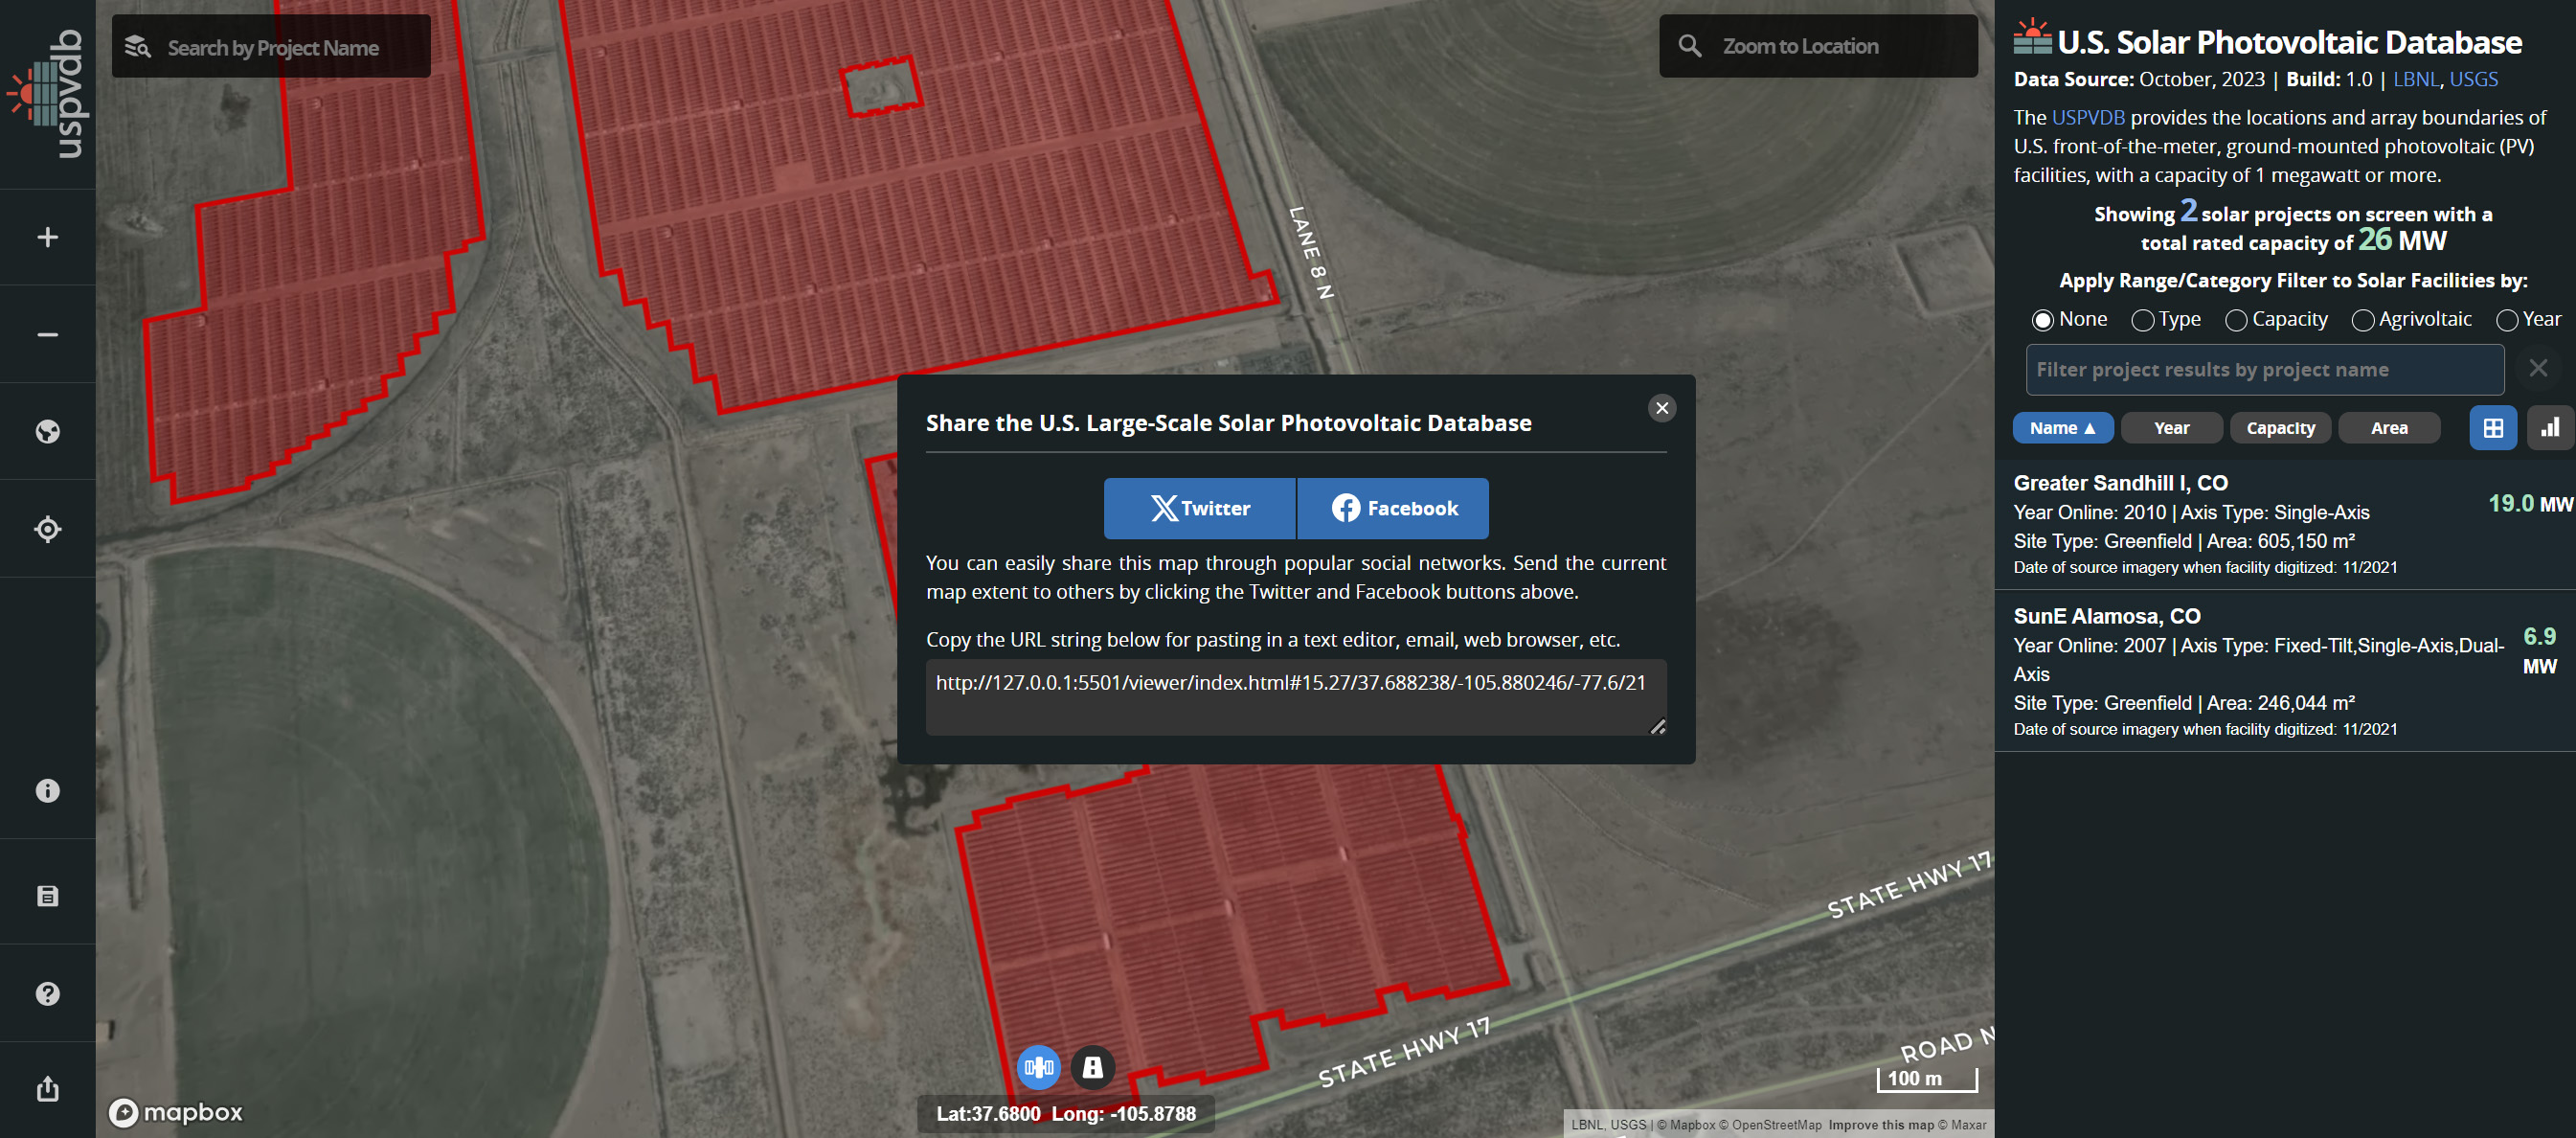
Click on the  icon to open the sharing window. The sharing window lets you send your current viewer window to popular social networking sites like X and Facebook. You can also copy the URL string for pasting in a text editor, or for sharing via email or web browser.
Everything you need to know so you can use the USPVDB like a pro. Browse through these FAQs and find answers to common USPVDB related questions. Got your own question? The best way to send questions is by emailing us directly.
Q: How many facilities are contained in the USPVDB?
As of April 2025, the USPVDB contains 5,712 facilities constructed between the late 1980s and 2024, spanning 47 states and Washington, D.C.
Q: How often is the USPVDB updated?
The USPVDB is updated annually based on data collected from the Energy Information Administration’s (EIA) Form 860. This form provides information on the status of electric generating facilities, including location, technology type, and capacity. Facilities that meet the following criteria are required to submit Form 860: (1) a capacity of 1 MW or greater, (2) connected to the local or regional electric power grid, and (3) will become operational within the next five years. The USPVDB updates will include all installations that began operation one year prior to the update but will also likely include more recent installations. Additionally, projects that are found during visual inspections of aerial imagery, some of which are suggested by USPVDB users, might be added despite not appearing in EIA records.
Q: What is the difference between AC and DC capacity?
AC (alternating current) and DC (direct current) refer to different types of electrical current. AC capacity is determined by the project inverters, which convert the DC power from the panels to AC, to align with the power grid. The DC capacity is the sum of the nameplate capacity of the solar panels. The values can be different. A standard average conversion is 1 DC MW is equal to 1.3 AC MWs, meaning for each MW of panels, approximately 1.3 MW of inverters are on-site; however, this can vary from project to project.
Q: What does the USPVDB viewer use, AC or DC MW?
The USPVDB viewer table highlights the AC capacity. The viewer's mouseover and other formats of the USPVDB include both AC and DC capacities.
Q: How do I cite the USPVDB if I want to use the data?
Fujita, K.S., Ancona, Z.H., Kramer, L.A., Straka, M., Gautreau, T.E., Garrity, C.P., Robson, D., Diffendorfer, J.E., and Hoen, B., 2023, United States Large-Scale Solar Photovoltaic Database vX.X (Month, YYYY): U.S. Geological Survey and Lawrence Berkeley National Laboratory data release, https://doi.org/10.5066/P9IA3TUS.
Q: How are facility locations data collected?
The project utilizes information from the EIA to identify facility locations, which are then verified and occasionally corrected by the USPVDB team. Verification of facility positions is conducted through visual interpretation of high-resolution aerial imagery. Additionally, projects discovered during this process that are not included in the EIA data are also added.
Q: What facility features are included within each polygon?
We digitize solar arrays (panels) and inverters within ten yards. Other facility features, such as access roads, fence lines, and buildings, are not included. Therefore, the polygons do not represent the total area of land that may have been affected by facility construction and operation, but rather just the direct area under and immediately around the panels and inverters.
Q: How are facility attributes data collected?
Facility characteristics data are drawn from EIA Form 860, supplemented with site type information from the Environmental Protection Agency (EPA) and the National Renewable Energy Laboratory (NREL). User feedback is also incorporated once verified with other sources. A detailed description of the data collection and verification process can be found in this paper.
Q: Why isn't the PV array on my property shown in the database?
Facilities that are known to be under 1 MW DC in capacity are excluded. Some >1 MW DC rooftop and parking lot canopy arrays may be included if they are reported in the EIA Form 860 data. For smaller systems, such as residential PV systems, Berkeley Lab’s Tracking the Sun should be referenced.
Q: Is there an international database available?
To our knowledge, the USPVDB is unique in terms of its level of detail and validation process, but the Global Solar Power Tracker is a useful resource outside the US.
Q: How much solar energy does it take to power an average home?
According to the U.S. Energy Information Administration, the average U.S. home uses 867 kilowatt-hours (kWh) per month. The median facility capacity in the USPVDB is 4.5 MW. That median facility would generate over 558,000 kilowatt-hours (kWh) per month - enough for over 640 average U.S. homes. Therefore, the average 4.5 MW solar facility generates enough energy in 68 minutes to power an average U.S. home for one month.
Q: How many facilities are installed in the U.S. each year?
On average, approximately 522 facilities with a capacity exceeding 1 MW DC were constructed in the U.S. each year from 2017 to 2023.
Q: What materials are PV panels made of?
Crystalline silicon (c-Si) panels represent the majority of the recently installed PV capacity in the U.S. (60% of 2022 utility-scale PV according to Lawrence Berkeley National Laboratory). Thin film panels, which make up the rest, may be made of a range of materials, including amorphous silicon (a-Si) and organic films, but are primarily comprised of cadmium telluride (CdTe).
Q: Why is it important to know the locations of PV facilities?
Understanding the locations of individual photovoltaic (PV) facilities and their technical specifications is essential for making informed siting decisions for future large-scale solar projects. This information supports effective planning and the efficient integration of energy into the grid, ultimately contributing to a more resilient energy future, while also facilitating responsible land and resource management.
Q: Why can't I see the records table when I'm zoomed far out?
At scales when the viewing window contains more than 300 projects, the records table is not populated. Simply zoom in to the area of interest to populate the records table.
Fujita, K.S., Ancona, Z.H., Kramer, L.A. et al. Georectified polygon database of large-scale solar photovoltaic sites in the United States. Sci Data 10, 760 (2023). https://doi.org/10.1038/s41597-023-02644-8.
The Solar Energy Technologies Office (SETO) at the U.S. Department of Energy (DOE) supports solar energy research, development, demonstration, and technical assistance to improve the affordability, reliability, and domestic benefit of solar technologies on the electric grid. Their website provides additional information regarding PV technologies, renewable energy siting processes, and other topics.
SETO also publishes Quarterly Solar Industry Updates. These include information on technology, cost, price, and performance trends along with broader industry developments and policy and market drivers—as well as summarizing both U.S. and global growth in the industry.
Lawrence Berkeley National Laboratory (LBNL) publishes annual data on utility-scale solar facilities (i.e., facilities with capacities greater than 5 MW (DC)). This effort includes a tabular database, report, and other documentation.
LBNL also publishes a Tracking the Sun report describing trends among grid-connected, distributed solar photovoltaic (PV), and paired PV + storage systems in the United States.
U.S. Energy Information Administration, Form EIA-860 detailed data, in Electricity: U.S. Energy Information Administration, http://www.eia.gov/electricity/data/eia860/.
U.S. Environmental Protection Agency (EPA), RE-Powering America's Land site and online mapper: https://www.epa.gov/re-powering.
NREL managed Innovative Solar Practices Integrated with Rural Economies and Ecosystems (InSPIRE) site that has more information on Agrivoltaic facilities: https://openei.org/wiki/InSPIRE.